| Submission
    Instructions:
       1.  All figures shall be
      submitted as Postscript (*.ps or *.eps)  files.   
      2.  As shown in example
      figures, please include indentifier provided by workshop organizers. 
      3.  Integral values shall be
      submitted as ASCII file. 
      4.  Transfer all files to IIHR
      anonymous ftp server 
      
        
          - connect to ftp.iihr.uiowa.edu
 
            login:  anonymous 
            password:  your email address 
          - change directory to /incoming/iihr/g2k
 
          - make a directory for yourself
            using either your last name or institution as the directory name
 
          - put all of your files in this
            directory
 
          - notify Dr. Volker Bertram
            (email: Bertram@hsva.de) that
            your submission is on the ftp server.


      Items for Model 5415
      comparisons & validation: 
      Table 1.  Integral
      variables:  CT, CF, Cp, k 


      Figure 1.   Wave profile
      on hull, comparison to EFD data 


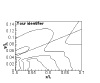
      Figure 2.  Wave cut at
      y/L=0.172, comparison to EFD data. 


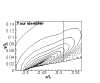
      Figure 3.  Wave cut at
      y/L=0.172, validation. 
      
        
        NOTES 
        1.  Comparison Error, E=D-S, where D is the data value, and S is
        the simulation value.  E% is obtained by normalizing by benchmark,
        i.e., E%=(D-S)/(validation scale)*100 
        2.  UV = sqrt(UD2+USN2)
        is the validation uncertainty [see equation 33 of  Stern
        et al. (1999)] 
        3.  UD is the data uncertainty. 
        4.  USN is the simulation numerical uncertainty [see
        equation 8 of Stern et al. (1999)] 
       
      Figure 4.  Wave-elevation
      contours, global view. 


      Figure 5.  Wave-elevation
      contours, bow detail. 


      Figure 6.  Wave-elevation
      contours, transom detail. 


      Figure 7.  Velocity field
      contours and cross-plane vectors at propeller plane 


      Figure 8.  Axial velocity in
      propeller plane along z/L=-0.02, comparison to EFD data. 


      Figure 9.  Axial velocity in
      propeller plane along z/L=-0.02, validation. 
      
        
        NOTES 
        1.  Comparison Error, E=D-S, where D is the data value, and S is
        the simulation value.  E% is obtained by normalizing by benchmark,
        i.e., E%=(D-S)/(validation scale)*100 
        2.  UV = sqrt(UD2+USN2)
        is the validation uncertainty [see equation 33 of  Stern
        et al. (1999)] 
        3.  UD is the data uncertainty. 
        4.  USN is the simulation numerical uncertainty [see
        equation 8 of Stern et al. (1999)] 
       
     |