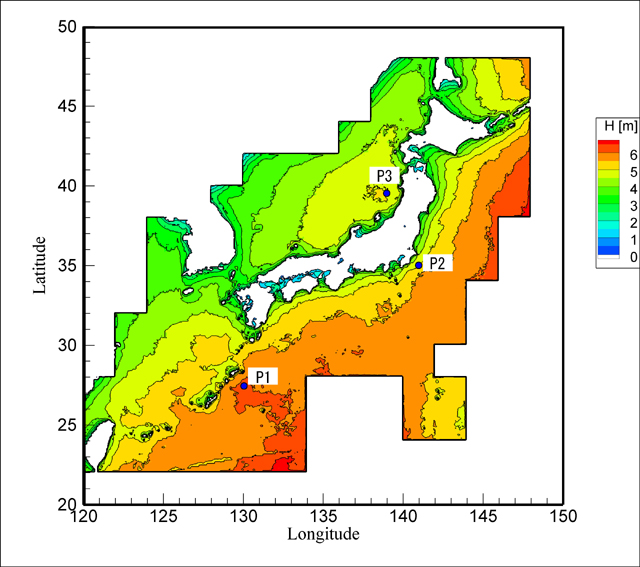
|  Points of calculation in contour chart of significant wave height at excess probability of 10-2. Points of calculation in contour chart of significant wave height at excess probability of 10-2. |
|
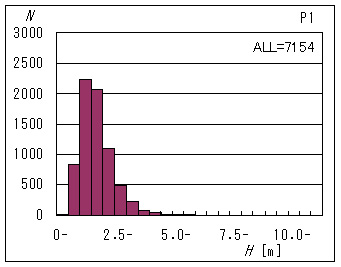
Histogram at P1; South East off the Amami Oshima Island.
(Left: significant wave height, Right: average wind speed.) |
|
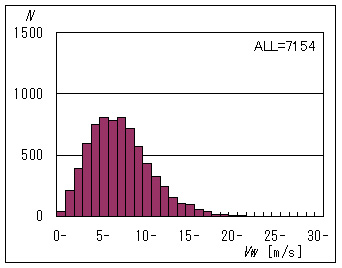
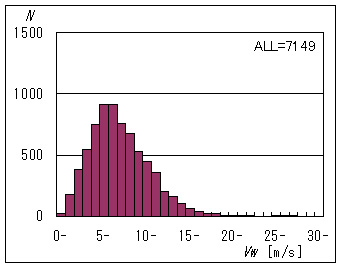
Histogram at P2; East off the Nojimazaki.
(Left: significant wave height, Right: average wind speed.) |
|
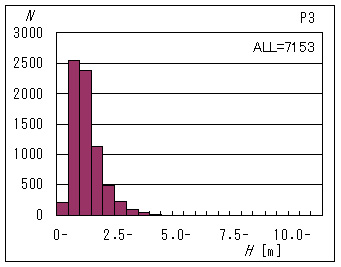
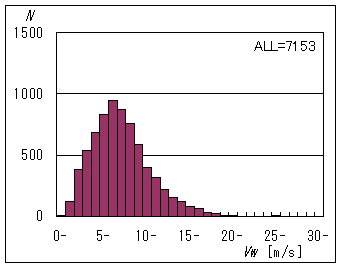
Histogram at P3; South West off the Oga Peninsula.
(Left: significant wave height, Right: average wind speed.) |
  |

