Experiments of a Running Wheelchair on a Slope, June. 2001
|
 A test driver, who usually uses the wheelchair and is a 20 generation woman, ran climbing direction and crossing direction on the experimental slope. The angle of the slope was changed from 0 to 7 degrees. She used our experimetal wheelchair, and the detailed data was measured. The measured results are shown in follows.
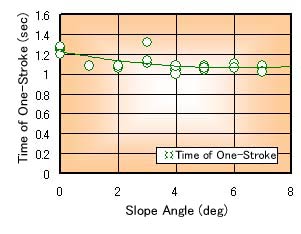 Fig. 1 Time in One-Stroke |
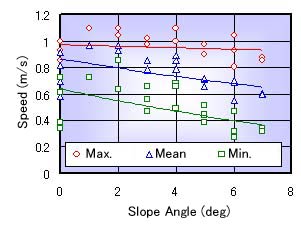 Fig. 2 Relation between Angle and Speed |

 Torque and Power of Climbing Running
The wheelchair runs by the driving force to the hand-rims. The value of the torque equals to the product of the driving force and a radius of the hand-rim. As the radius is the constant, then the torque means the powerfulness of the driving force.Figure 3 shows the relation between the slope angle and the measured results of the maximum and mean torque at the climbing running. From the figure, the torque increases with increasing of the angle. That is, the driver gives strong firce, when the slope has large angle.
The power has the unit of Watt (W). This is the energy per one second. The power becomes big when the wheelchair runs with high speed and strong force. Even if the driver gives strong force, the power does not become big when the wheelchair with slow speed. Namely, the power is affected by the speed strongly.
Figure 4 shows the relation between the slope angle and the measured results of the maximum and mean power at the climbing running. When Fig. 4 is compared with Fig. 3, the power increases with increasing of the angle gently. When the slope angle is big, the torque (the driving force) becomes big. Also the speed becomes slow as shown in Fig. 2, then the power reaches the upper limit.
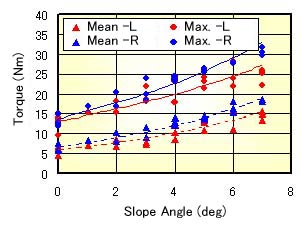 Fig. 3 Relation between Angle and Torque |
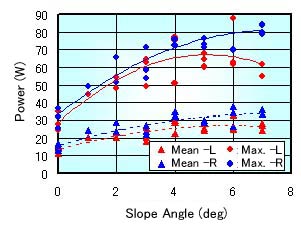 Fig. 4 Relation between Angle and Power |

Operation and Speed of Crossing Running
Figure 5 shows the relation between the angle of the slope and the time in one-stroke (one-cycle for a paddling) of the crossing running. From the figure, the time of one-stroke somewhat decreases with incresing of the angle. in the case of the crossing running, the wheelchair has a turning force to the lower direction by the structure of the wheels and the center of gravity. From Fig. 5, it is considered that the time for the revision of the direction becomes long with increasing of the angle. However, the change of the time is small, so the driver always operated with the well-balanced rhythm.
Figure 6 shows the measured results of the maximum, mean and minimum speed. From the figure, the spped is not changed too much, even if the angle is changed. This also means that the driver always operated with the well-balanced rhythm.
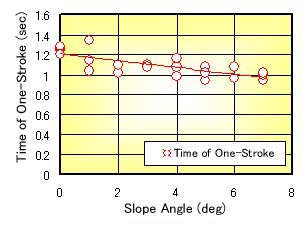 Fig. 5 Time in One-Stroke |
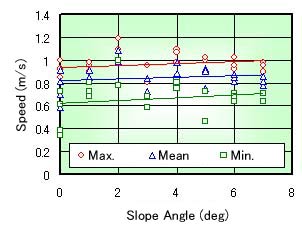 Fig. 6 Relation between Angle and Speed |
Torque and Power of Crossing Running
Figures 7 and 8 show the relation between the slope angle and the measured results of the maximum, mean and minimum torque at the crossing running. In this experiment, the left of the wheelchair is the lower side of the slope. Figure 7 shows that of the lower wheel (the left wheel). Figure 8 shows that of the upper wheel (the right wheel). The torque of the lower wheel increases with increasing of the angle as the same of the climbing running. On the other hand, the torque of the upper wheel decreases with increasing of the angle. Then the mean torque becomes negative number more than about 4 degrees of the angle. That is, the upper wheel is braked for the revision of the direction.
Figures 9 and 10 show the relation between the slope angle and the measured results of the maximum, mean and minimum power at the crossing running. These figures look like that of the torque (see Figs. 7 and 8). It is considered that the speed of the moving is not changed too much with changing of the angle.
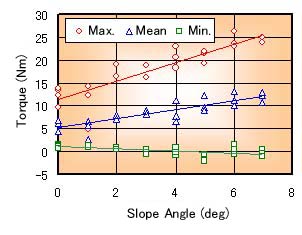 Fig. 7 Relation between Angle and Torque (lower side) |
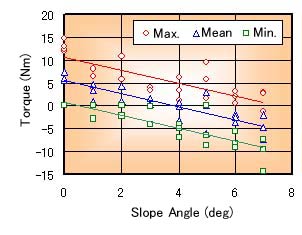 Fig. 8 Relation between Angle and Torque (upper side) |
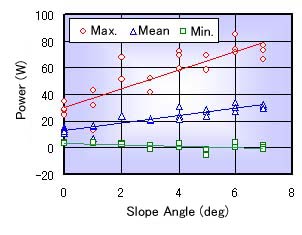 Fig. 9 Relation between Angle and Power (lower side) |
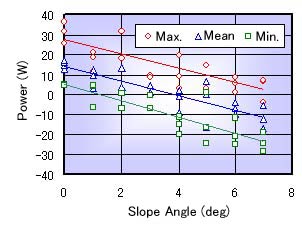 Fig. 8 Relation between Angle and Power (upper side) |
Turning Performance of Crossing Running
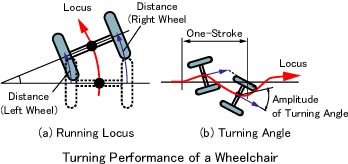 Figures 11 to 14 show the measured results of the crossing running. The maximum turning angle shown in Fig. 11 means the angle of which the wheelchair turns the most of the left (the most lower side). The minimum turning angle means the angle of which the wheelchair turns the most of the right (the most upper side). When the measuring of the wheelchair is started, the turning angle is set to 0. The measured data in Fig. 11 is scattered. This is caused that the change of the turning angle is small, and the initial locaition of the wheelchair is affected strongly.
Figure 12 shows the relation between the slope angle and the different of the maximum and minimum turning angle. This means a degree of snake-running (the change of the direction in one-stroke). The angle difference increases with increasing of the slope angle, though it is scattered.
Figure 13 shows the relation between the slope angle and the shift distance to the side direction. This also means a degree of snake-running (the change of the movement in one-stroke). The shift distance increases with increasing of the slope angle, though it is scattered.
Figure 14 shows the relation between the slope angle, the maximum turning angle velocity (falling direction) and the minimum turning angle velocity (climbing direction). The turning angle velocity is the change of the turning angle per one second. The maximum turning angle velocity means the violence of the falling. The minimum turning angle velocity means the busyness of the driver's operation. Namely, these results show that, when the slope angle is big, the falling becomes violent, and the operation becomes busy.
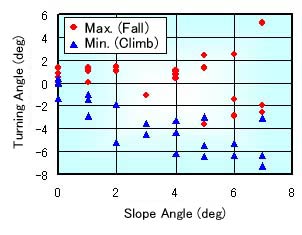 Fig. 11 Slope Angle and Turning Angle |
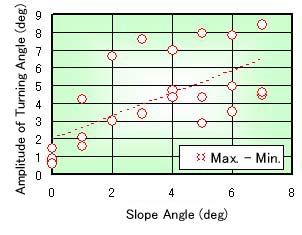 Fig. 12 Slope Angle and Amplitude of Turning Angle |
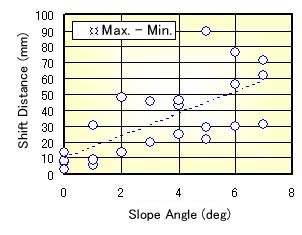 Fig. 13 Slope Angle and Shift Distance |
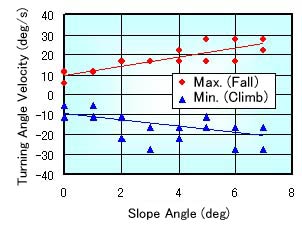 Fig. 13 Slope Angle and Turning Angle Velocity |
Conclusion
In this page, we inroduce the experimental results of the hand-operated wheelchair on the experimental slope. We hope that these expeimental data will be good useful to estimate the safety and the comfortableness on a waving ship as the basic data. However, a wheelchair is operated by a human, and the running characteristics are strongly chaned by one's operation and control ability. Therefore it is difficult to estimate the safety and the comfortableness. More detailed researches are needed in the next step.The above results are measured with the wheelchair oprated by a skilled driver. The driver always operated with the well-balanced rhythm. Thus, we make sure that the results have high quality, and will be useful for the next step.
As the acknowledgement, we express our heartfelt thanks to Ms. Nana Ogawa for her cooperation.
[ Barrier-free HOME ] [ NMRI HOME ]