| Prototype Fish Robot, PF-300 Koichi Hirata, updated on January 25, 2000 
Prototype Fish Robot, PF-300Prototype Fish Robot, PF-300 was designed and built to optimize turning performance.
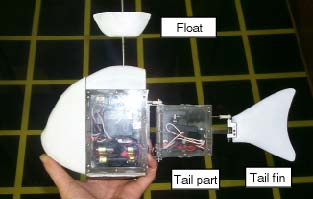
Structure of the PF-300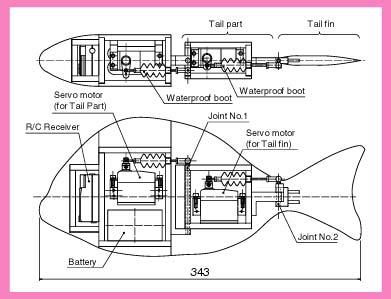 A left figure shows the structure of the PF-300. The body length is about 340 mm. A radio control (R/C) receiver is located in a head. A battery and one servomotor (servo) for moving the tail peduncle is located in a body. Another servo for moving the tail fin only is located in the tail peduncle. To waterproof the link mechanism, rubber boots were used.
We decided to design the prototype to simulate a Sea Bream fish. We then copied the shape and location of body parts of this type of fish. Of course, we needed to limit the number of vertebral joints; we decided two joints were sufficient.
The head and top of the body are arranged and shaped from foam material. Weights were put on the head and lower side of the body for balance. In the operation, a float made of wood attached to the body was used to mount the R/C antenna. This allows the PF-300 to swim at a constant depth in the water. We made the tail fin of hard wood. Outline of the experimental system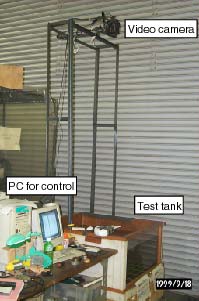 This photo shows the experimental setup. The PF-300 experiment is composed of a small test tank (900 mm x 900 mm). A video camera set above the test tank. Using pictures from the video camera, turn diameter and a turning time were measured.
Outline of the experimental method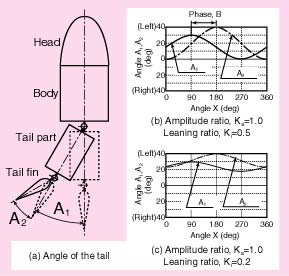 This prototype allows for a great range of movement patterns; it proved highly flexible and useful for our study.
In this experiment, the base movement pattern or swimming motion is given as a sine curve with a bias to the left or right. The figure at the right shows an outline of this pattern. The angle of the tail peduncle with respect to the body, A1 and the angle of the tail fin with respect to the tail peduncle, A2 are shown in next equations. Propulsion and steering performance depend on the magnitude, frequency and phase relationship between angles A1 and A2 during the tail stroke. The mathematic model for this behavior is described here.
A1=KaA1maxsinX+A1max(1-Ka)Ki--------(1) When, A1 = A1max and A2 = A2max, the tail peduncle and tail fin are bent to the maximum Åghard overÅh to one side. In this experiment, A1max = 30 degrees, and A2max = 40 degrees. When A1 = A2 = 0, the system is Ågfeathered,Åh as though a fish were coasting or sitting, with body parts positioned in a straight line. Ka is an amplitude coefficient that is the ratio of (actual operating amplitude) / (potential maximum amplitude) of the tail section oscillation, it ranges from 0 to +1. When Ka = 0, the tail is not moving at all. When Ka = +1 the tail sections are moving at their maximum amplitudes. Note that Ka is applied to both servos, although each servo Amax is different. Ki is a steering bias coefficient and ranges from -1 to +1. When Ki = 0 there is no steering bias; this means that the tail section amplitude is equal to the left and to the right. This results in zero applied steering force, only a propulsion force. A constant positive bias, Ki is applied to turn left, negative to turn right. Ka and Ki were set at constant values during this experiment; it greatly simplified the study. B is a phase difference between the tail peduncle servo and tail fin servo. The tail assembly reacts in a periodic motion to the drive system. All phase relationships are described in reference to X, the drive angle that repeatedly goes through a full 360-degree rotation. Reference angle X is defined at any point in terms of time by measuring the time from X = 0 to the time of measurement. X may be calculated in terms of time by this equation: X = 2 x Pi x f x t--------(3) F = frequency in Hz. t = elapsed time in seconds between the time when X = 0 and the time of measurement, t. In this experiment, the frequency, f, was set to 2.2 Hz Phase angle, B was set to a constant 90 degrees. Amplitude coefficient, Ka was varied from 0.2 to 0.5. The steering bias, Ki was set from 0.6 to 1.0.
Experimental results (with sine curve locomotion)These photographs are composites derived from video recordings. They demonstrate turning performance with different values of Ka and Ki. This shows that the PF-300 can be moving suitably.
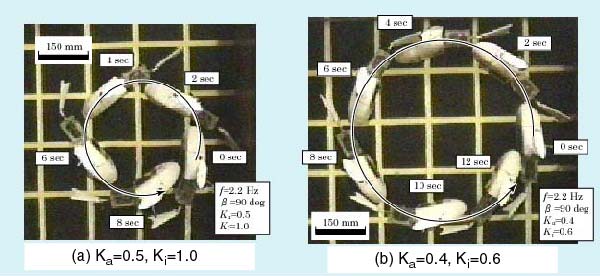 Individual pictures comprising the composites may be seen by clicking here.
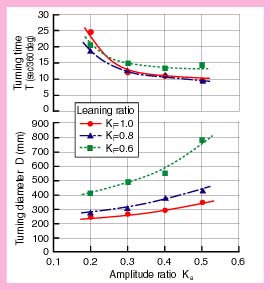 The figure to the left shows experimental results of the relationships between the amplitude coefficient, Ka and the turning diameter, D and circling time, T, the time needed to complete a full 360-degree circle. This figure shows that the turning diameter, D decreases with the smaller amplitude coefficient, Ka, and the circling time, T increases with the smaller amplitude coefficient, Ka. When the amplitude coefficient, Ka is set small, the turning bias of the tail becomes relatively large, though the total thrust force of the fish robot is decreased. Also, this figure shows that although the turning diameter D decreases with the smaller turning bias, Ki, the circling time, T is not markedly affected. Circling time T is almost independent of the turning bias, Ki.
Experimental results (Quick turn)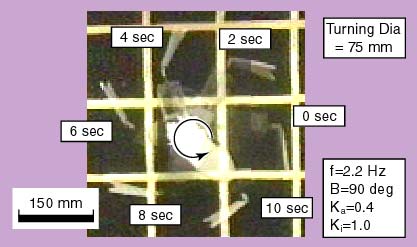 This photograph is a composite taken from a video of the quick turn performance. The motion of the tail fin is not sinusoidal.
CAD data of the PF-300The CAD files (AutoCAD LT 2000, DWG format) are available. You can download and use them just as you please. However, the Japanese fonts may not show correctly on your PC.
CAD data of the PF-300 (Only Assebling plan, ZIP, 43 kMB)
Movies of the PF-300Four movies are available.
(1) Quick turn (Quick Time, 2.9MB) [ Power and Energy Engineering Division ] [ Hirata HOME ] [ NMRI HOME ] |
| Contact khirata@nmri.go.jp |
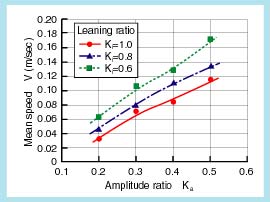 The figure to the left shows experimental results of the relation between the amplitude coefficient, Ka and the mean swimming speed, V (=2PiD/T). This figure shows that the swimming speed, V increases with an increasing amplitude coefficient, Ka. Also, the swimming speed, V decreases with a decreasing turning bias coefficient, Ki. The reason is that the thrust force is increased when the amplitude coefficient, Ka is set to big and the turning bias coefficient, Ki is setting to small.
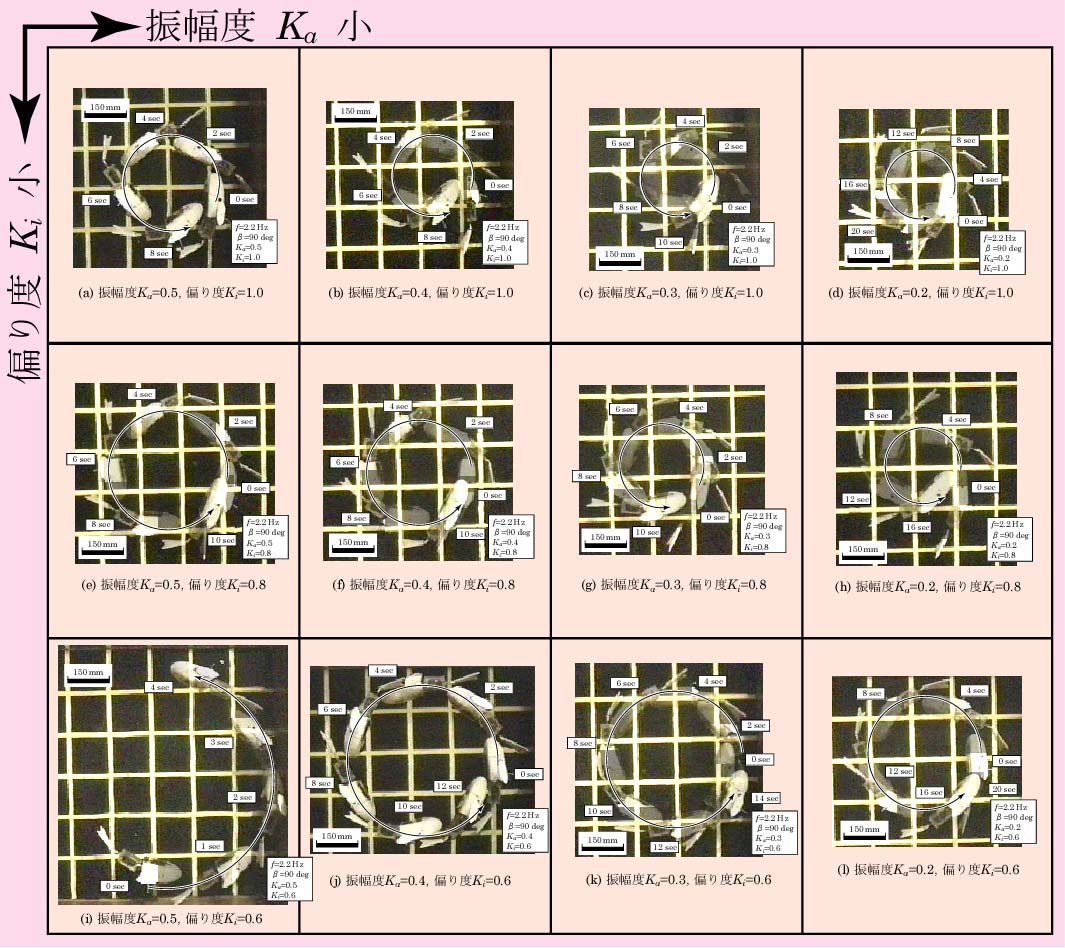