Straight Propulsion Performance of the PF-300
Experiment on November 22 through 24, 1999

|
Straight propulsion performance test
In this experiment, straight-line speed is measured while changing frequency, f, Phase, B, and the amplitude ratio, Ka using Prototype fish robot, PF-300. In order to measure the speed, a tow train runs next to the PF-300 that is operated by radio control. Speed is determined by measuring with a stopwatch the time it takes to swim 1 meter's length.
|
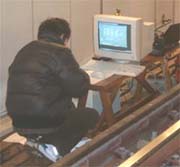
Mr. Warashina at the experimence
(a student in 1999)
|
|
Relation between frequency and speed
The figure at the right shows experimental results of the relationships between the amplitude coefficient, Ka, frequency, f and swimming speed, V. This figure shows that the speed, V increases with higher frequency, f. For any given value of Ka, the speed increases with an increase in frequency until it reaches a critical point after which the speed begins to decrease.
Also, the speed, V is increases with the higher amplitude coefficient, Ka. When the amplitude coefficient, Ka is greater than 0.6, this increase in speed effect begins to decrease. We believe the reason for this may be due to some hydrodynamics force taking over as a limiting factor. We could not confirm that because of the limitations due to the limited torque available at higher frequencies. We could not conclusively determine this because the servo system ran out of available torque at the higher speeds.
From the experimental results, resistance forces limit speeds reached at amplitude coefficient, Ka of 0.2 or less. Propulsion forces become swamped by resistance forces at these Ka ratios.
|
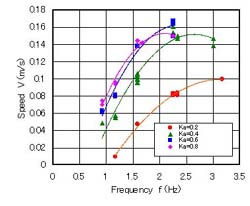
Fig. Relationships between frequency and speed
|
|
Relation between phase and speed
The figure at the right shows experimental results of the relationships between the amplitude coefficient, Ka, phase, B and swimming speed, V. This figure shows that the speed, V becomes maximum when phase, B is between 20 to 50 degrees. Generally, when the phase is set to 90 degrees, the highest propulsion efficiency is obtained. However, we cannot lead the propulsion efficiency.
|
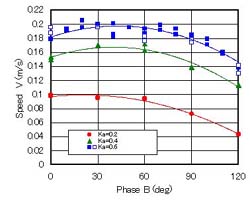
Fig. Relationships between phase and speed
|
|
Relation between amplitude of oscillation and speed
The figure to the right shows experimental results of relationships between the amplitude coefficient, Ka, frequency, f and swimming speed, V. This figure shows that the speed, V is affected by the amplitude coefficient, Ka strongly, when the amplitude coefficient, Ka is set to a small value. As described above, this reason is that the torque and rotating speed of the servomotors are not sufficient to evaluate performance in these ranges. |
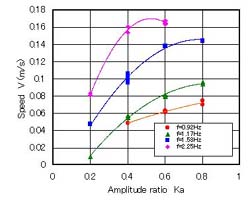
Fig. Relationships between amplitude of vibration and speed
|
|
Conclusions
In this experiment, the maximum speed of the PF-300 was about 0.2 m/s at Ka=0.6, f=2.3Hz, and B=20 degrees. The speed per the body length is not higher than any former model fish robots. This was of no concern because the PF-300 was designed and aimed at high turning performance.
Also, when the amplitude coefficient, Ka and frequency, f were set to small values, the PF-300 has low speed it was confirmed that the PF-300 moves with a large rolling motion. As a next step, I would like to research including such behavior.
|
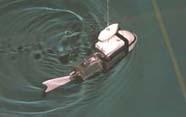
The PF-300 in the experiment
|
[Experimental Fish Robots]
[ Fish Robot Home Page ]
[ Power and Energy Engineering Division ]
[ Hirata HOME ]
[ NMRI HOME ]
|