Support Transportation in Case of Disaster (2016.04.06)
DATA SYSTEM RESEARCH GROUP
Research Introduction of Data System Research Group
Support Transportation in Case of Disaster
The Great East Japan Earthquake caused extensive damage to infrastructure systems such as electricity, water, and gas. But it also disrupted relief supply transportation systems, causing problems with supplies not reaching evacuation centers. This problem has occurred not only in the Great East Japan Earthquake but also in the Great Hanshin-Awaji Earthquake and the Niigata Chuetsu Earthquake and is a recurring problem in large-scale earthquakes. Table 1 lists the elements necessary for transportation.
Table 1 Necessary elements of the transportation system
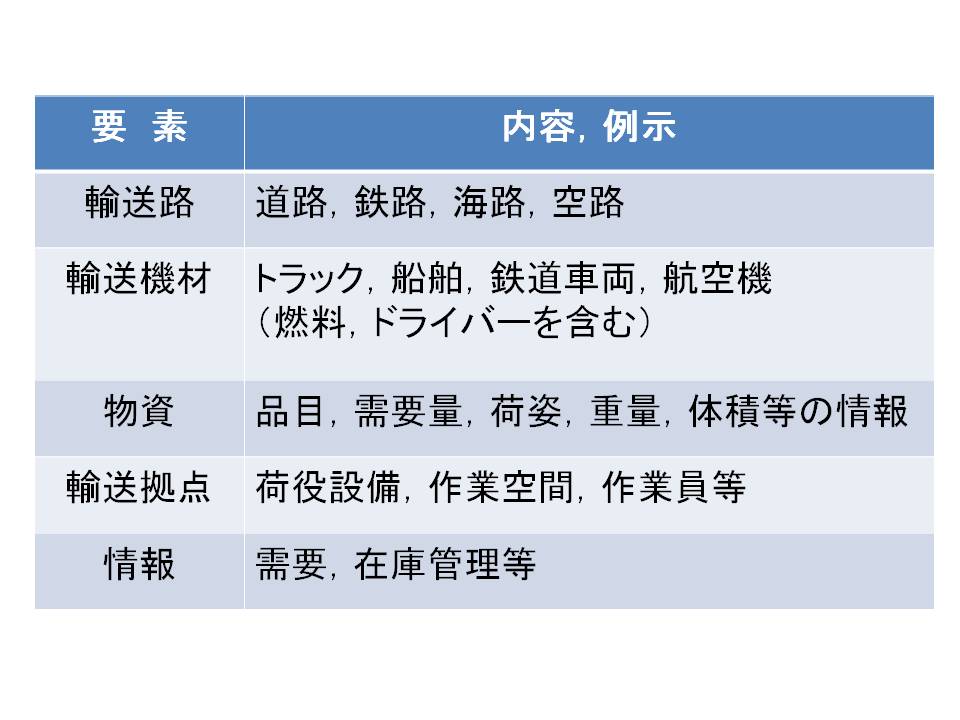
Table 1 lists the items that are necessary naturally for transportation operations but are also requirements to ensure that we can carry out the operations without delay. In other words, if one of these items is under-capacitated or missing, the entire system's transport capacity will be compromised. However, in a chaotic disaster, meeting all of these items can be a daunting task. For this reason, each municipality is preparing in ordinary times by stockpiling supplies and concluding disaster transportation agreements to fulfill the items in Table 1.
■Disaster Transport Simulator
The elements shown in Table 1 are necessary for smooth transportation, but having these elements in place does not tell us how much transportation capacity can be secured. Or, it is unclear where the items limiting transport capacity (called bottlenecks) are. Therefore, we are attempting to develop a simulator that can reflect the elements in Table 1 and identify transportation capacity and bottlenecks. Table 2 summarizes the input/output data for this simulator.
Table 2 Simulator input/output data
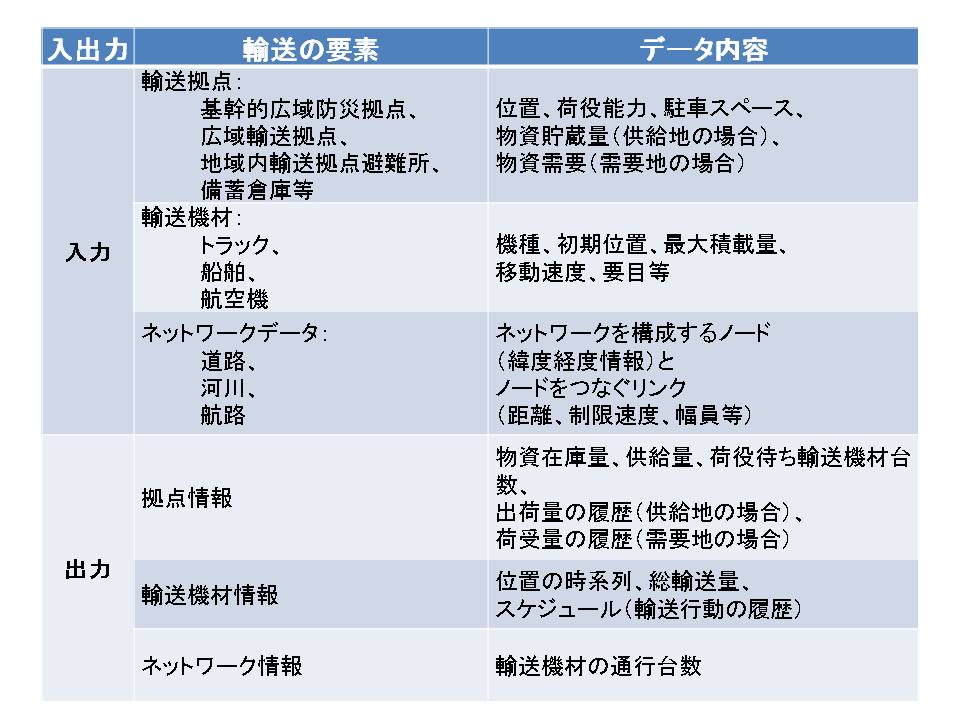
The developed simulator runs on Windows, reads the "input data" shown in Table 2, performs the analysis, and saves the items listed in the "output data" as a result in a file. The simulator user can look at the output transport volume to determine whether the overall transport system is good or bad. In addition, various possible disaster conditions can be reflected in the "input data" (for example, we can reflect damage to ports and roads as restrictions on loading and unloading speeds and traffic speeds) so that we can find weak points and bottlenecks in the transportation system in advance for disaster prevention planning purposes.
■Simulator Analysis Example
We show below an example of analysis using the developed simulator. Figure 1 shows the road and route network used in the simulation. The road network consists of emergency transportation roads designated by each municipality, and the route network is specified to avoid huge detours on the shortest route between two ports. Although the network shown here covers all of Japan, it is possible to simulate transportation within a city, town, or village by replacing the data.
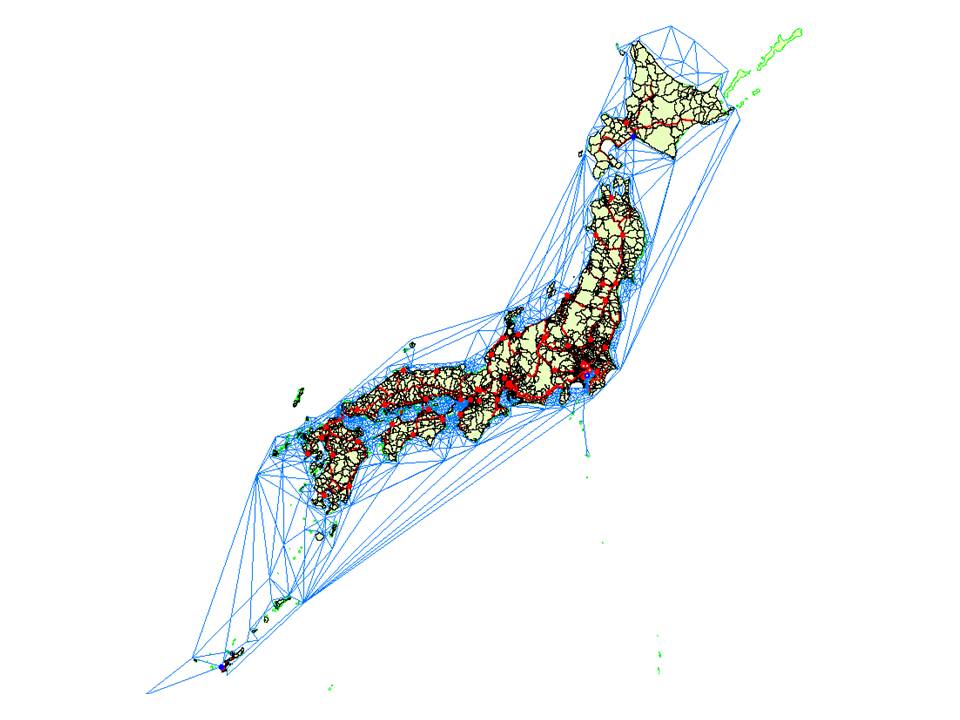
Figure 1 Road and route network on transport simulation
Figure 2 shows the transport volume using the network shown in Figure 1 when approximately 2,000 trucks and 50 large vessels are adopted. Figure 3 also shows the traffic volume on the network by color. (Red indicates heavy traffic.) The analysis results simulate support transportation from Japan to Saitama, Chiba, Tokyo, and Kanagawa Prefectures.
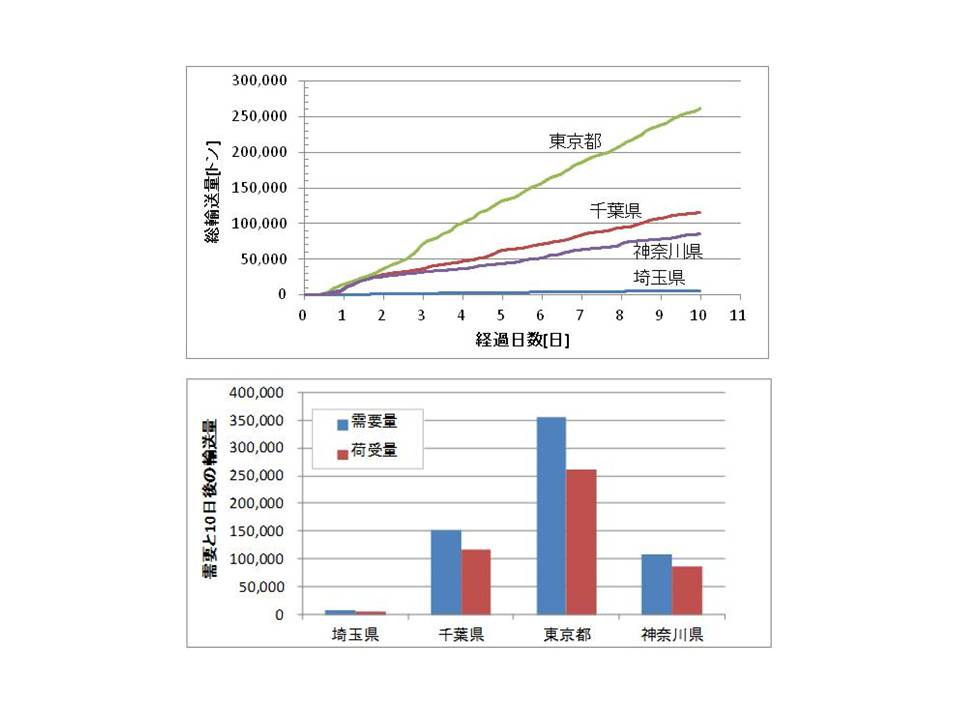
Figure 2 Simulation results (transport volume)
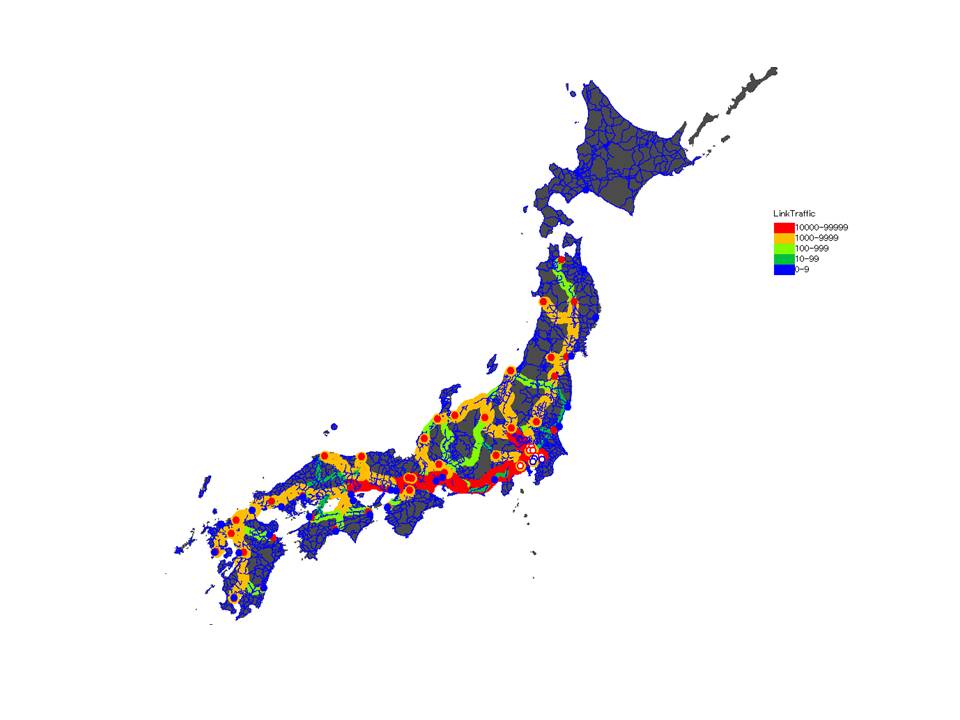
Figure 3 Simulation results (traffic volume)
As shown in this example analysis, the user of this simulator can vary the transport conditions and observe the effects on the transport and traffic volumes shown in Figures 2 and 3. Utilizing this simulator will lead to understanding the capacity and bottlenecks in the transportation system as formulated in the disaster management plan. Please refer to the following document for an overview of this simulator.
- 間島隆博, 災害時における救援物資の輸送体制とシミュレータ, サプライチェーンリスク管理と人道支援ロジスティクス, 久保幹雄・松川弘明編, 近代科学社, pp.201-234 (2015)
- 間島隆博, 矢野裕之, 災害時物資輸送シミュレータとシミュレーション解析, 第32回日本物流学会全国大会研究報告要旨集, pp.53-56 (2015)