Ships in Ice
SHIPS IN ICE
With the aim of promoting commercial use of the Northern Sea Route, which is expected to be put to practical use as a route connecting Asia and Europe, a method for estimating the ship performance navigating in ice, construction of ice condition data along the Northern Sea Route, and evaluation of speed and fuel efficiency under the condition of navigation in icy waters are carried out.
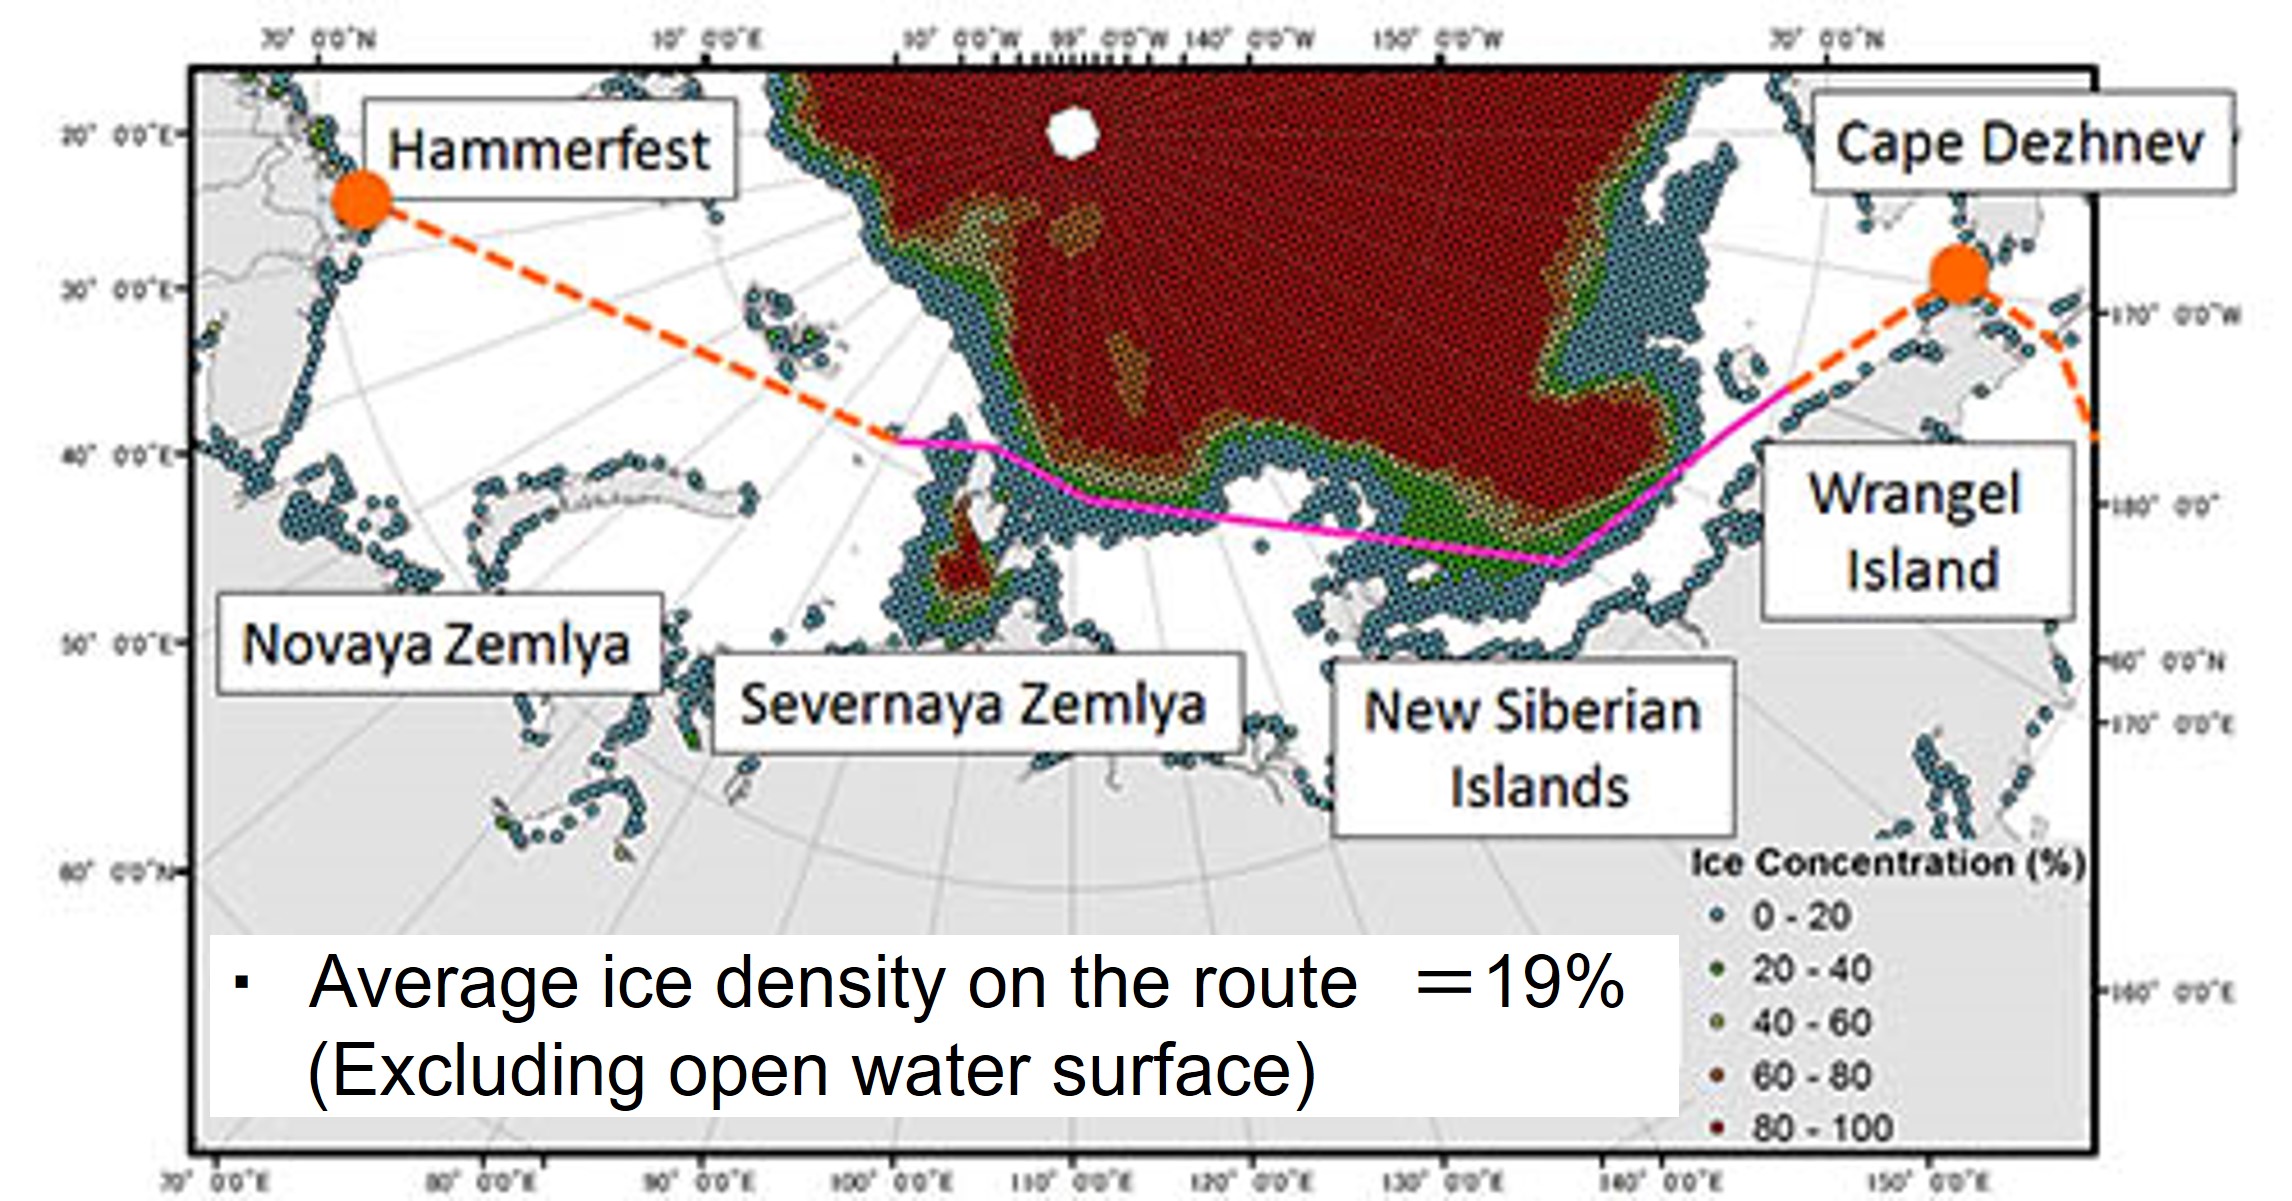
Northern Sea Route is one of the shortest route connecting Asia and Europe through the northern part of Russia. The colored part (blue ~ red) is the ice distribution in September 2013, and the red one indicates that there is more ice. During the summer months with less ice, ice-class ships pass through this short route. The lines drawn in the figure would be the most ideal route assuming the ice distribution in the figure.
Ships in ice require a large amount of main engine power because they move forward by breaking and pushing away ice. It is also necessary to have a hull structure that withstands ice collisions. For this reason, ships in ice are usually designed and built to meet the Ice Class Rules. For example, Finnish-Swedish Ice Class Rules stipulates a formula for calculating the minimum propulsion power of the main engine required in brash ice channel.
Considering the added resistance model in the ice and the operation of the main engine, the change in speed, rotation speed, and fuel consumption of a bulk carrier (217 m length) is estimated. The horizontal axis of the figure is the degree of ice concentration C, 0~10 indicates the degree of concentration (0 is no ice, 10 is perfect concentration), and h represents ice thickness (m).
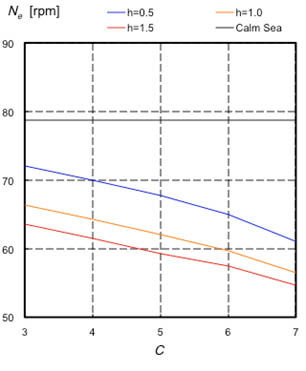
The figure above shows the change in the main engine rotation speed Ne. When the degree of ice adhesion C increases, it can be seen that the rotation speed cannot be increased due to the torque limit of the main engine.
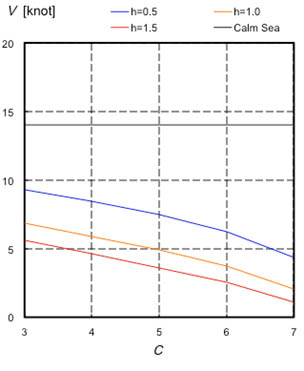
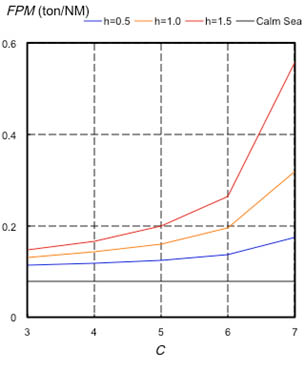
The figure on the left shows the change in the ship speed V1, and the figure on the right shows the change in fuel consumption FPM per nautical mile. It can be seen that when the ice concentration C is 5 (50%) or more, the performance deterioration is remarkable.
Compare the number of days and fuel consumption between via Suez and Northern Sea Routes.
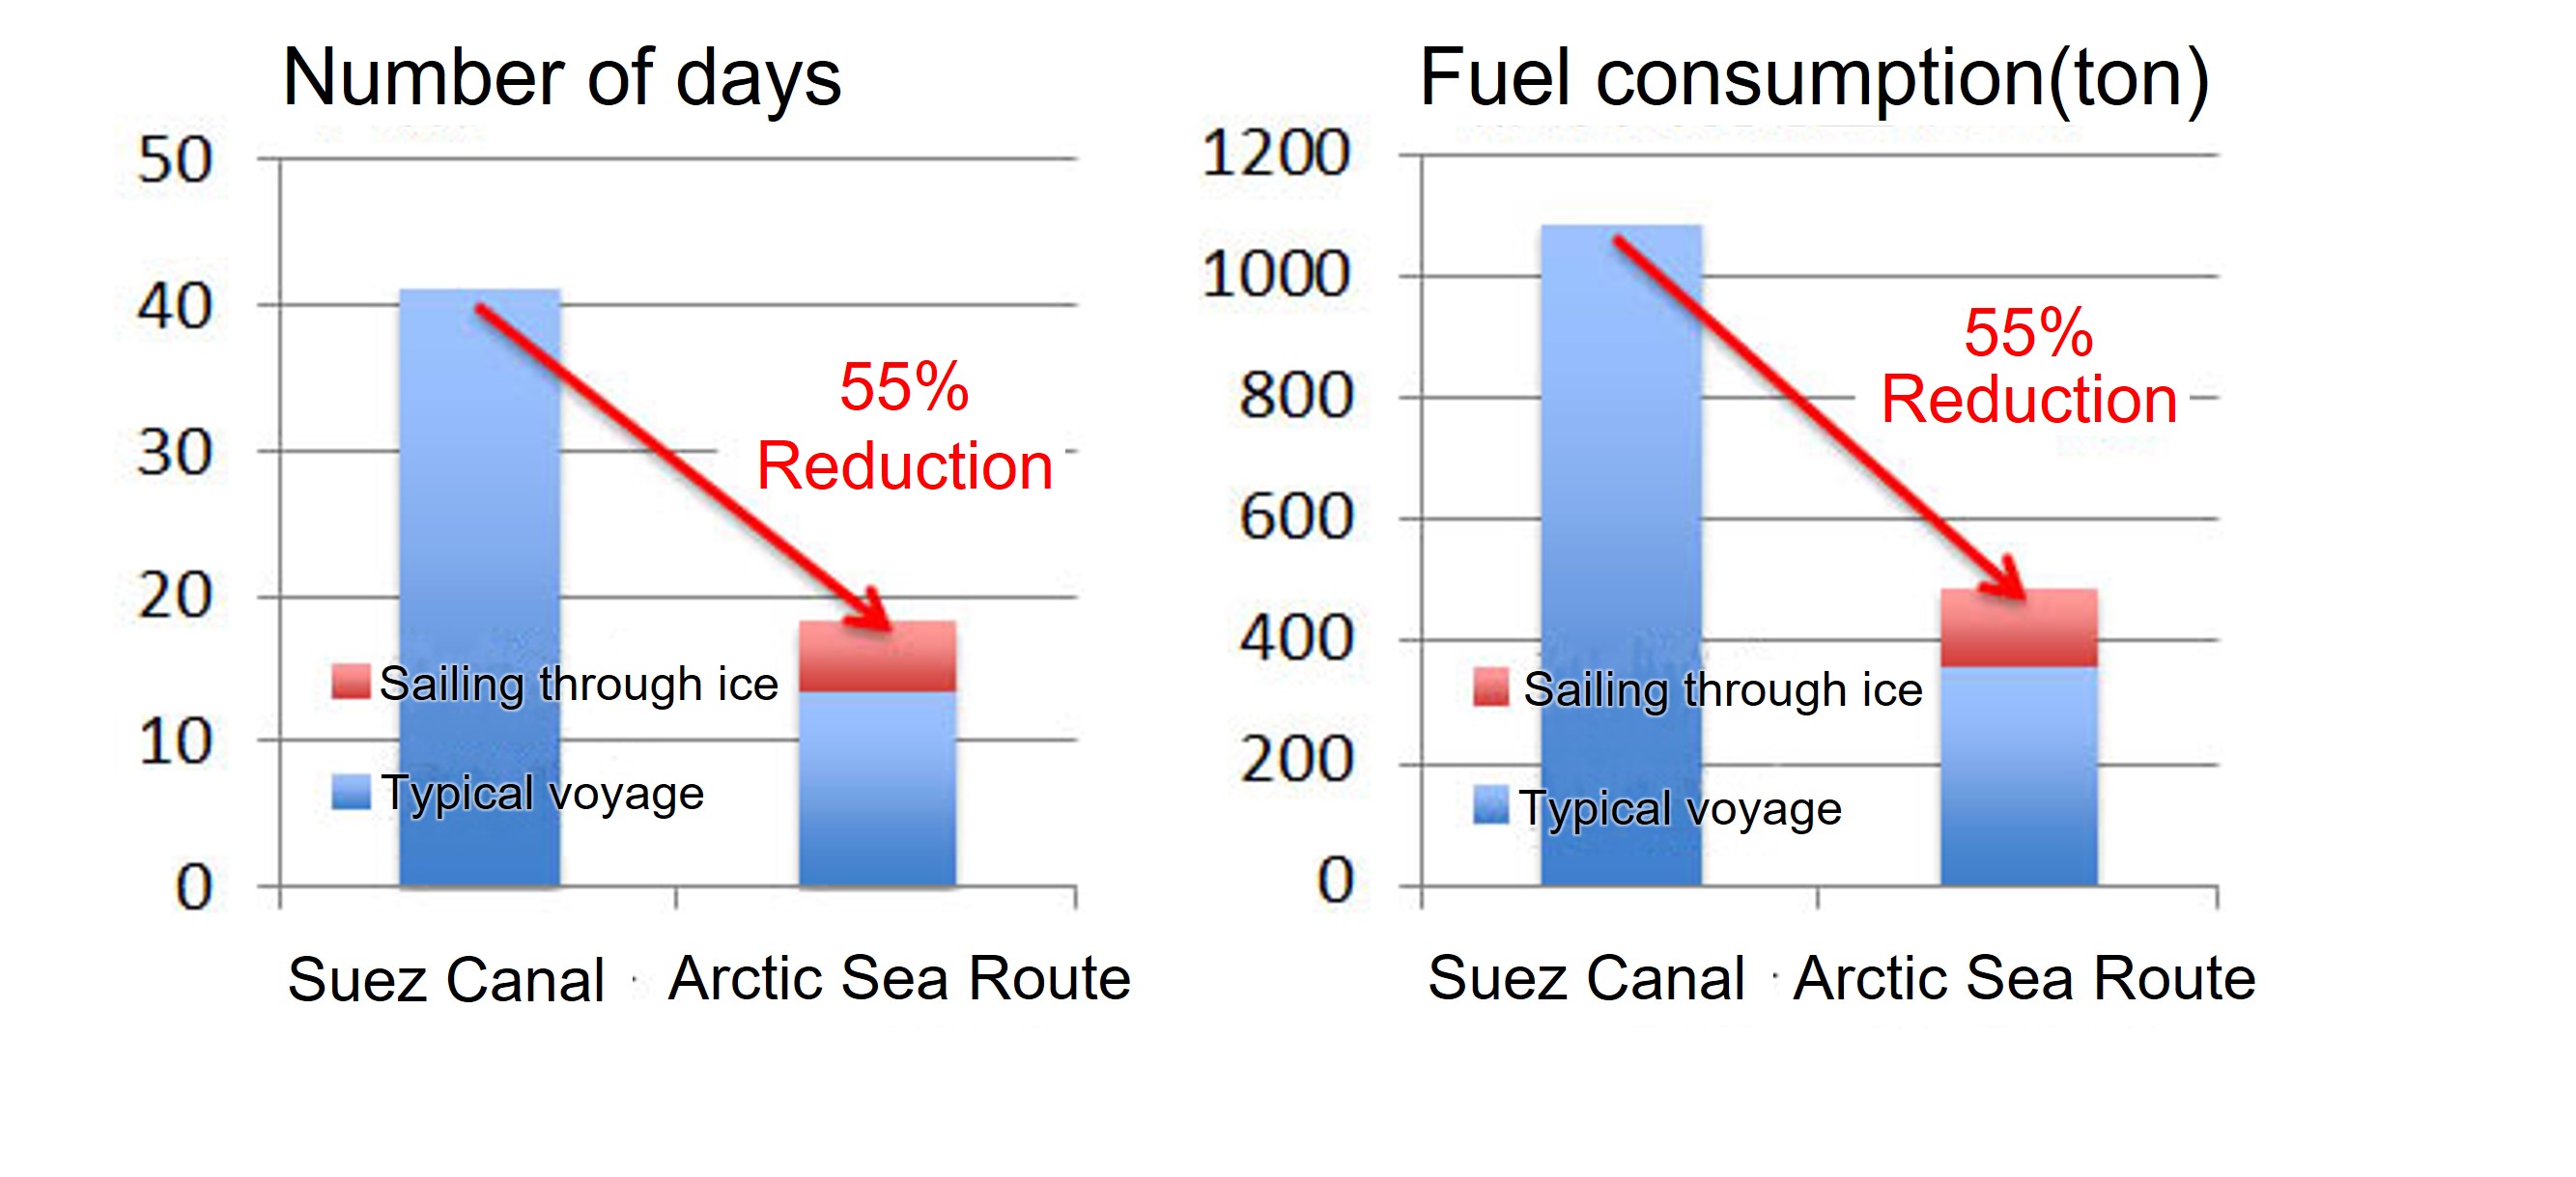
Under the given conditions (ice distribution in September 2013, equivalent to ice class 1A, etc.), it can be seen that the number of days and fuel consumption may be significantly reduced compared to via Suez.
*Note that these data are based on simple condition settings. Since it fluctuates greatly depending on the conditions, it is not always a significant reduction.
Reference
- Uto, S., Takimoto, T., Matsuzawa, T.: Development of the Vessel Performance Simulator along Northern Sea Route : Verification of the Resistance Prediction Model of Ships in Pack Ice, Conference proceedings, the Japan Society of Naval Architects and Ocean Engineers (17), pp.303-306, 2013 (in Japanese).
- Uto, S., Takimoto, T., Shimoda, H., Wako, D. and Matsuzawa, T.:Verificaion of the Simple Calculation Method of Resistance in Floe Ice by the Field Measurement in the Sea of Okhotsk, Proc. 29th Int. Symp. on Okhotsk Sea and Sea Icee, pp.87-91, 2014.
- Sogihara, N., Matsuzawa, T. and Uto, S.:Development of "VESTA" ーNavigation Performance Simulator in Ice-free Watersー and its Application to Arctic Navigation, Proc. 29th Int. Symp. on Okhotsk Sea and Sea Icee, pp.87-91, 2014.
- Matsuzawa, T., Sogihara, N., Tsujimoto, M. Uto, S.: Development of the Vessel Performance Simulator along Northern Sea Route : Improvement of the Resistance Model of Ships in Pack Ice and an Example of Computation, Conference proceedings, the Japan Society of Naval Architects and Ocean Engineers (18), pp.455-458, 2014 (in Japanese) .
- Matsuzawa, T., Sogihara, N., Tsujimoto, M. and Uto, S.: NSR Transit Simulations by Vessel Performance Simulator "VESTA" Part 1 Speed Reduction and Fuel Consumption in the Summer Transit along NSR, Proc. 23rd Int. Conf. on Port and Ocean Engineering under Arctic Conditions, 2015.
- Uto,S., Shimoda, H., Wako, D. and Matsuzawa, T.: NSR Transit Simulations by Vessel Performance Simulator "VESTA" Part 2 Simple Resistance Formula of Ships in Floe Ice, Proc. 23rd Int. Conf. on Port and Ocean Engineering under Arctic Conditions, 2015.